Case study · 2025–2026
Goals System
Research is clear on what makes goals work: a wish, a clear outcome, the obstacle in the way and a plan, broken down from year to quarter to week. Doing all of it is a lot. I spent a year learning the method and living it by hand. Then I designed and built one app that guides you through it step by step, explains what each step needs, and leaves out everything else.
- 1 yearof research and living the method before any design
- Step by stepthe app shows what's needed next
- 0manual counting. Weeks roll up to quarters and years
- Problem
- A goal method that works but has many layers: year, quarter and week goals, each with its own outcome, obstacle and plan. By hand, across three spreadsheets, it was easy to get lost.
- What I did
- A year of research and living the method, then deciding what to keep and what to cut. I planned the flow, designed it in Figma, built it in React and Firebase, tuned the motion, and iterated through live usability sessions.
- Result
- One live app on phone and desktop that guides you one step at a time. Progress rolls up from week to year on its own, and I use it every week.
- Role
- Solo · research, product design, motion, engineering
- Timeline
- Aug 2025 – Nov 2026
- Stack
- React, TypeScript, Firebase, Figma, Claude Code
Origin
A year of learning what actually matters
It started with a goal-setting workshop by Ali Abdaal1. I kept pulling the thread through books on identity and tiny habits2, research on how goals are reached3, and WOOP for turning obstacles into plans4.
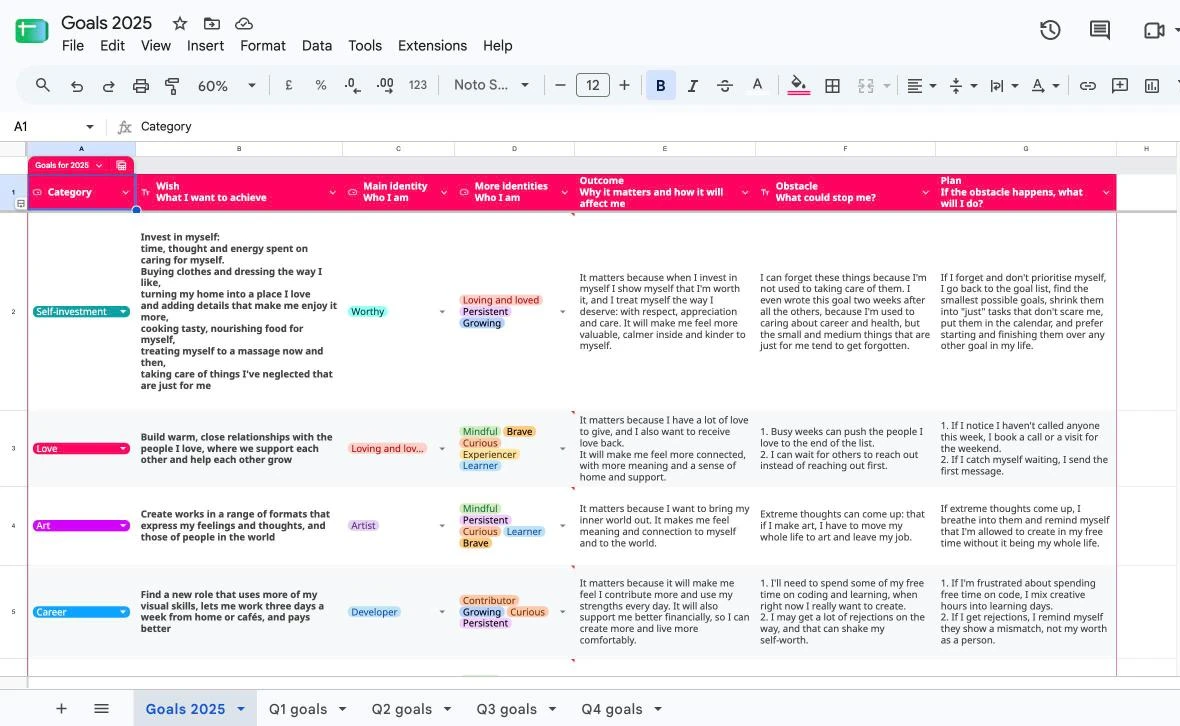
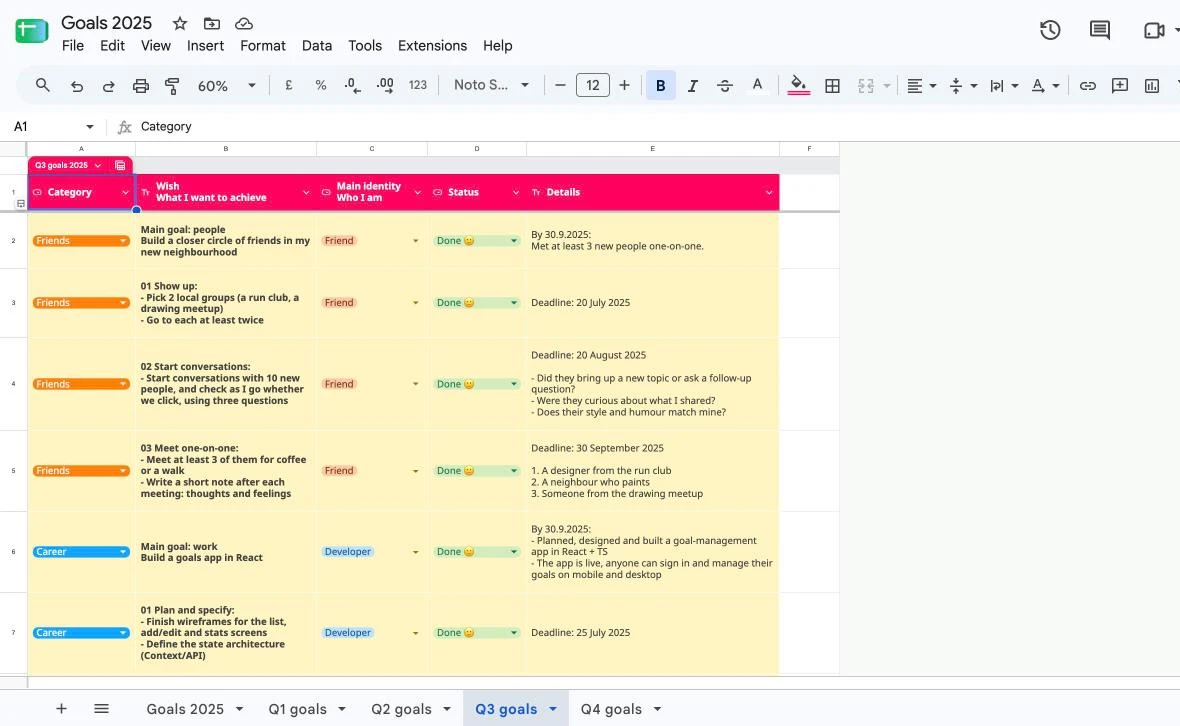
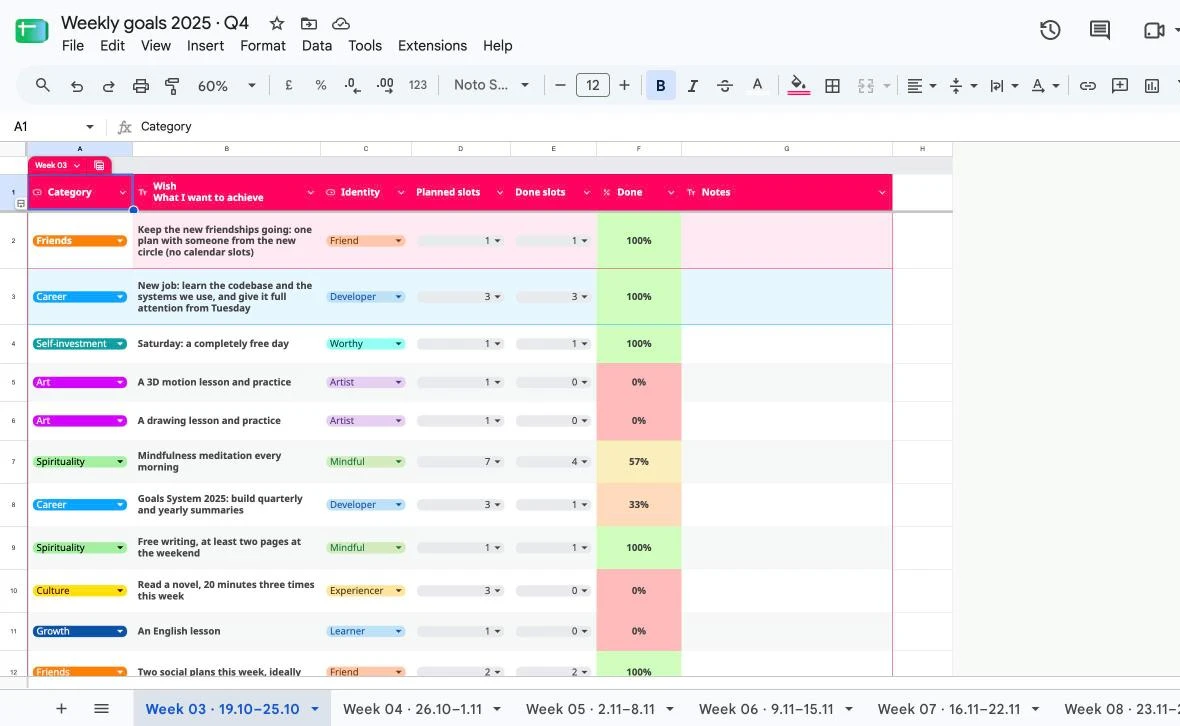
I turned it into my own method and ran it in Google Sheets for a year, writing down every moment it got in the way.
The method worked, but it has many layers: a wish, an outcome, an obstacle and a plan for every goal, from year to quarter to week. Living it by hand showed me which parts really helped and which only added work. That became the brief: keep what works, guide people through it one step at a time, and cut the rest.
- Ali Abdaal, goal-setting workshop and How to actually achieve your goals
- James Clear, Atomic Habits · BJ Fogg, Tiny Habits · Ali Abdaal, Feel-Good Productivity
- Huberman Lab, The Science of Setting & Achieving Goals
- Gabriele Oettingen, WOOP
What got in the way became the requirements
To know why a weekly task mattered, I had to jump between three spreadsheets. Everything was updated by hand, data went missing, and no human could count completions across every tab. I lost track of what I wanted and of what I'd already done. I decided to build an app to solve all of those frictions.
- Jumping between 3 spreadsheets for contextbecomesYear, quarter and week in one app, each goal linked to its parent
- Copying a tab and updating everything by handbecomes“New week” in one tap. Progress updates itself
- Incomplete data, no quarter or year overviewbecomesCompletion rolls up from week to quarter to year
- Awful to update on the phonebecomesMobile-first, one-tap − / + logging
- WOOP buried in another sheetbecomesAn If → Then line on every card
Plan before pixels
The MVP plan, before any code or Figma
Requirements, data model, flows, wireframes and the component tree on one board. I weighed a separate type per level against one goal interface, and computing progress on load against updating parent goals on every change.
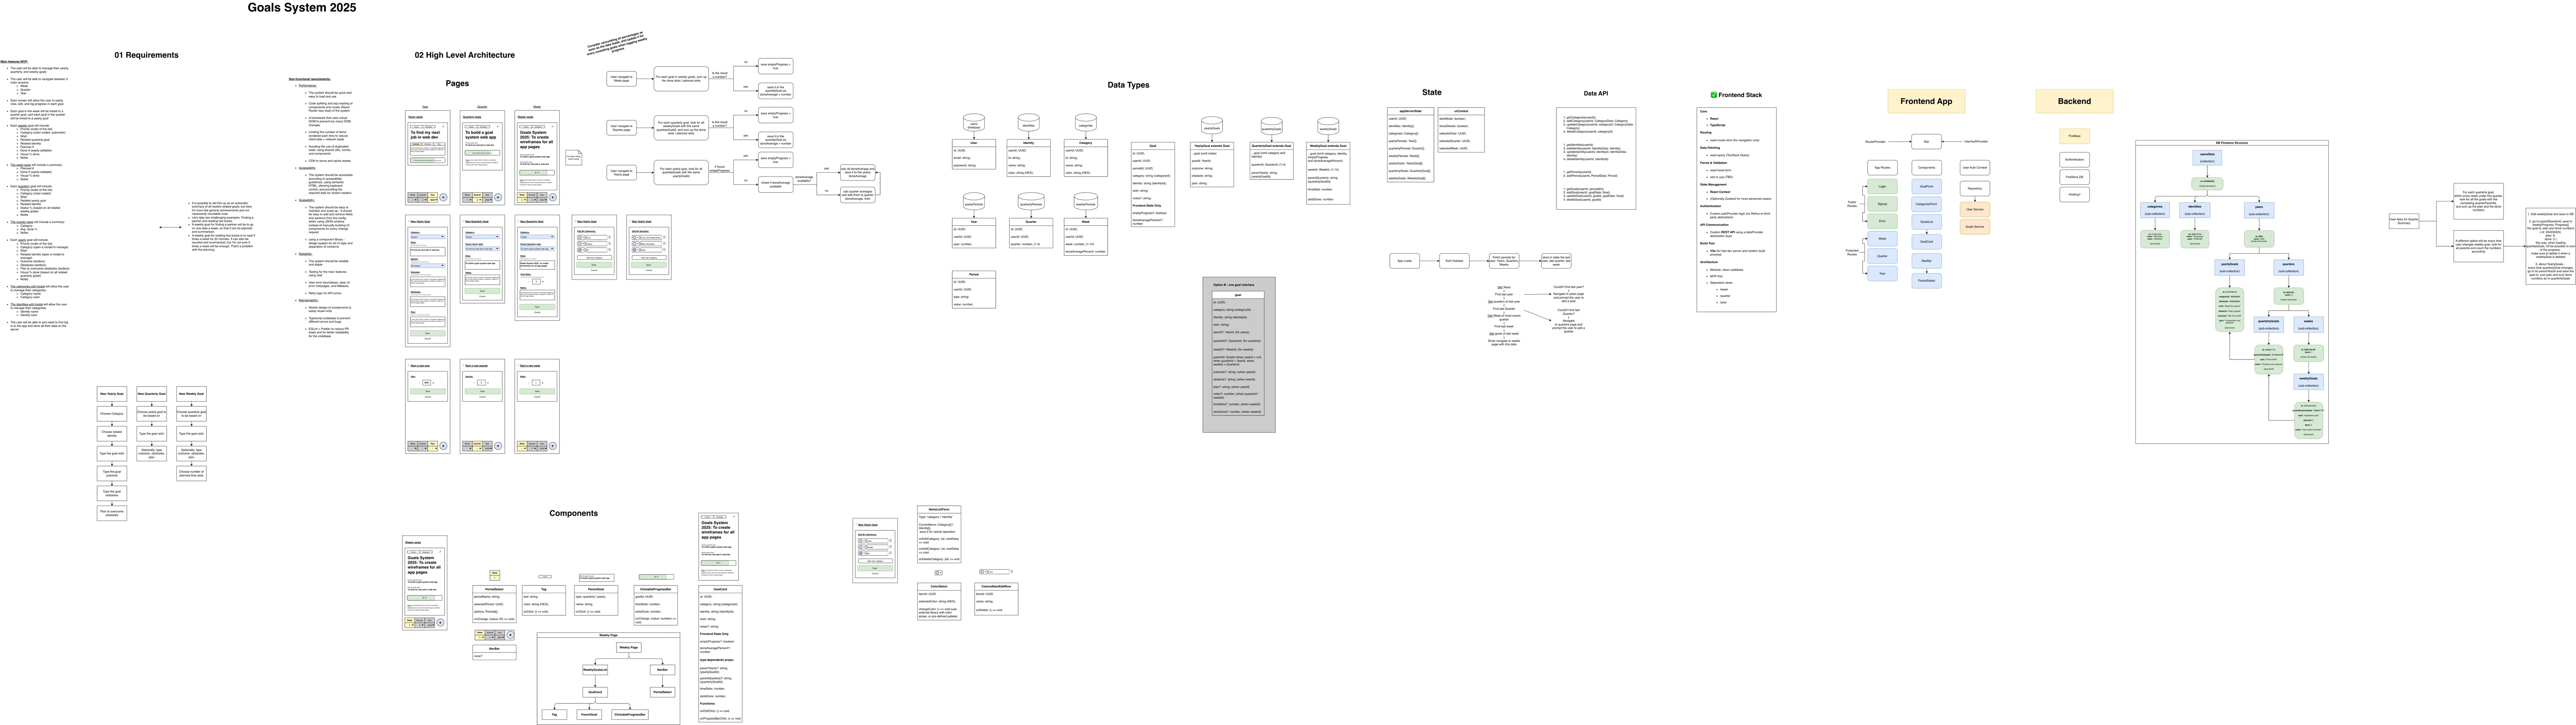
The real draw.io board. Drag to explore it, or jump to a section.
v1, real users, fast iteration
Shipped, watched people use it, audited it
I ran live usability sessions, sitting next to people while they set up their own goals in the app. Then I iterated fast with Claude Code: editing, safe delete rules, drag and drop, quarterly and yearly summaries, shipped in days rather than weeks.
Before redesigning, I audited v1 myself. It confirmed what people had run into.
What I saw, and what changed
- Landed on an empty week, didn't know the first stepbecomesSmart redirect to the right level + next-step hints
- Couldn't tell category from identitybecomesIdentities cut. One tag per goal
- Too much on the cardbecomesOne pill, a ⋯ menu, a one-line WOOP preview
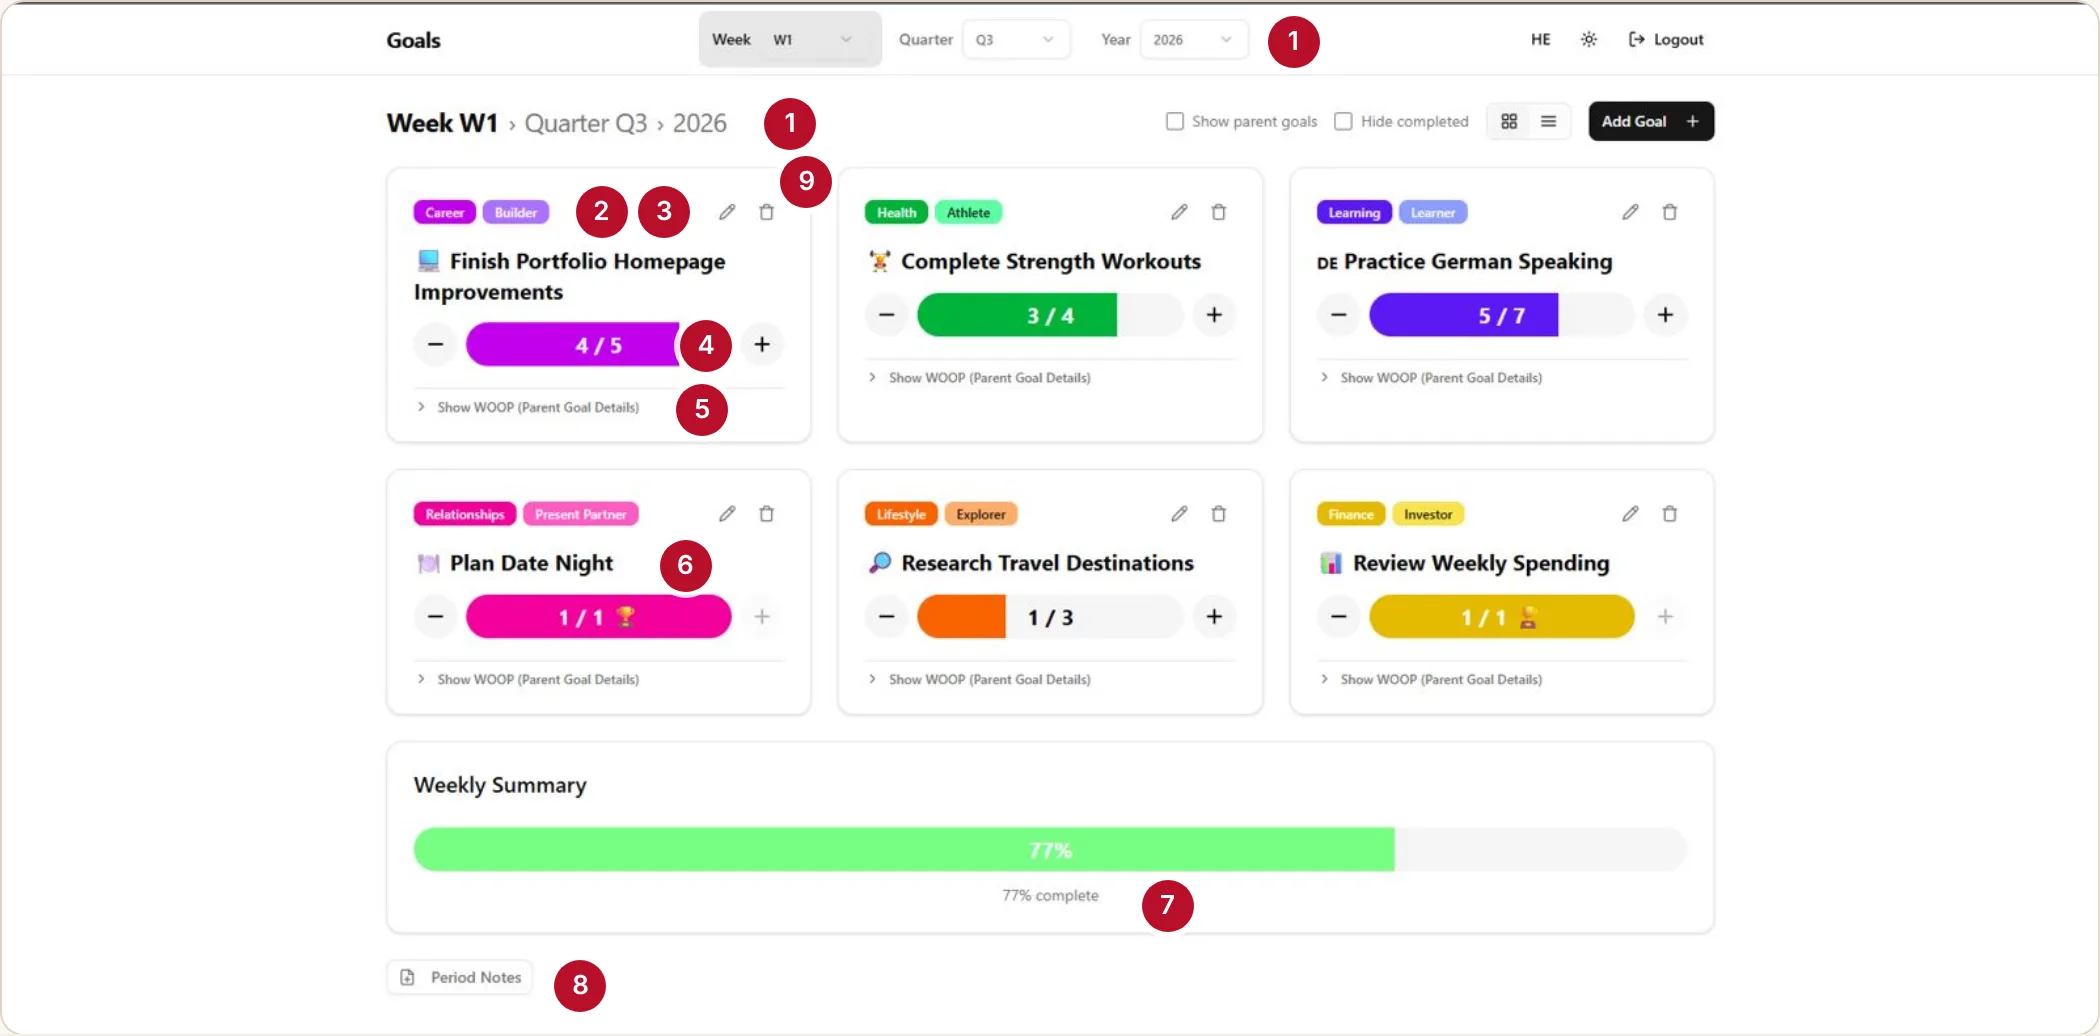
- The period is shown twice: pickers and breadcrumb
- Category and identity chips say the same thing
- Edit and delete on every card
- The bar's colour shouts louder than the title
- “Show WOOP (Parent Goal Details)” hides the plan behind a vague label
- A done goal looks the same as one in progress
- A big summary bar with little meaning
- Period notes buried at the bottom
- Every card has the same weight, so nothing says what's next
Explore → decide
Redesigning the Week view and the goal card
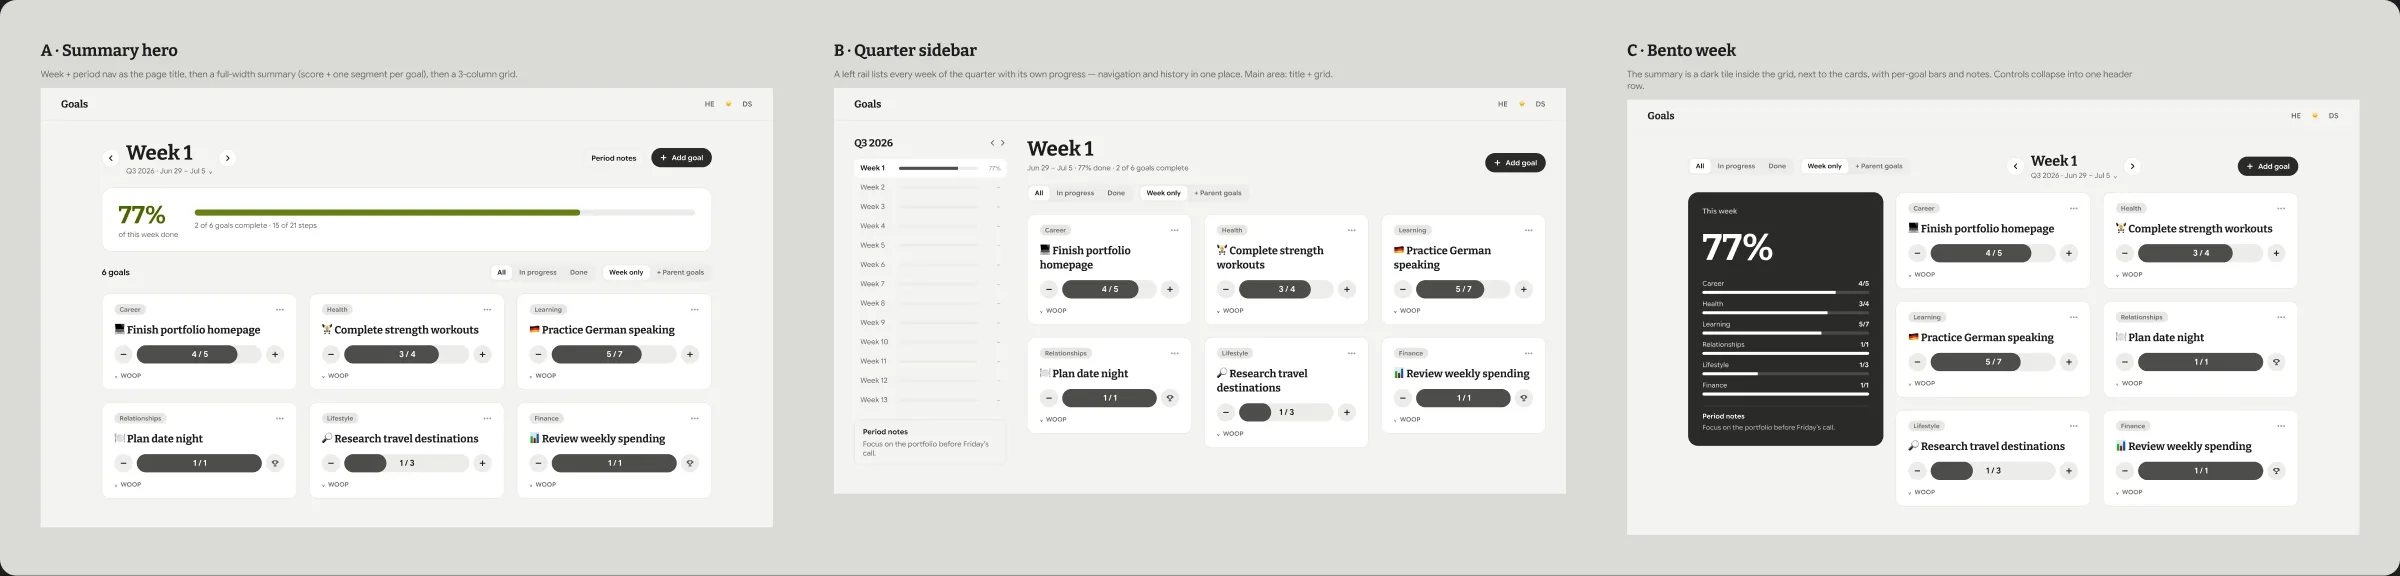
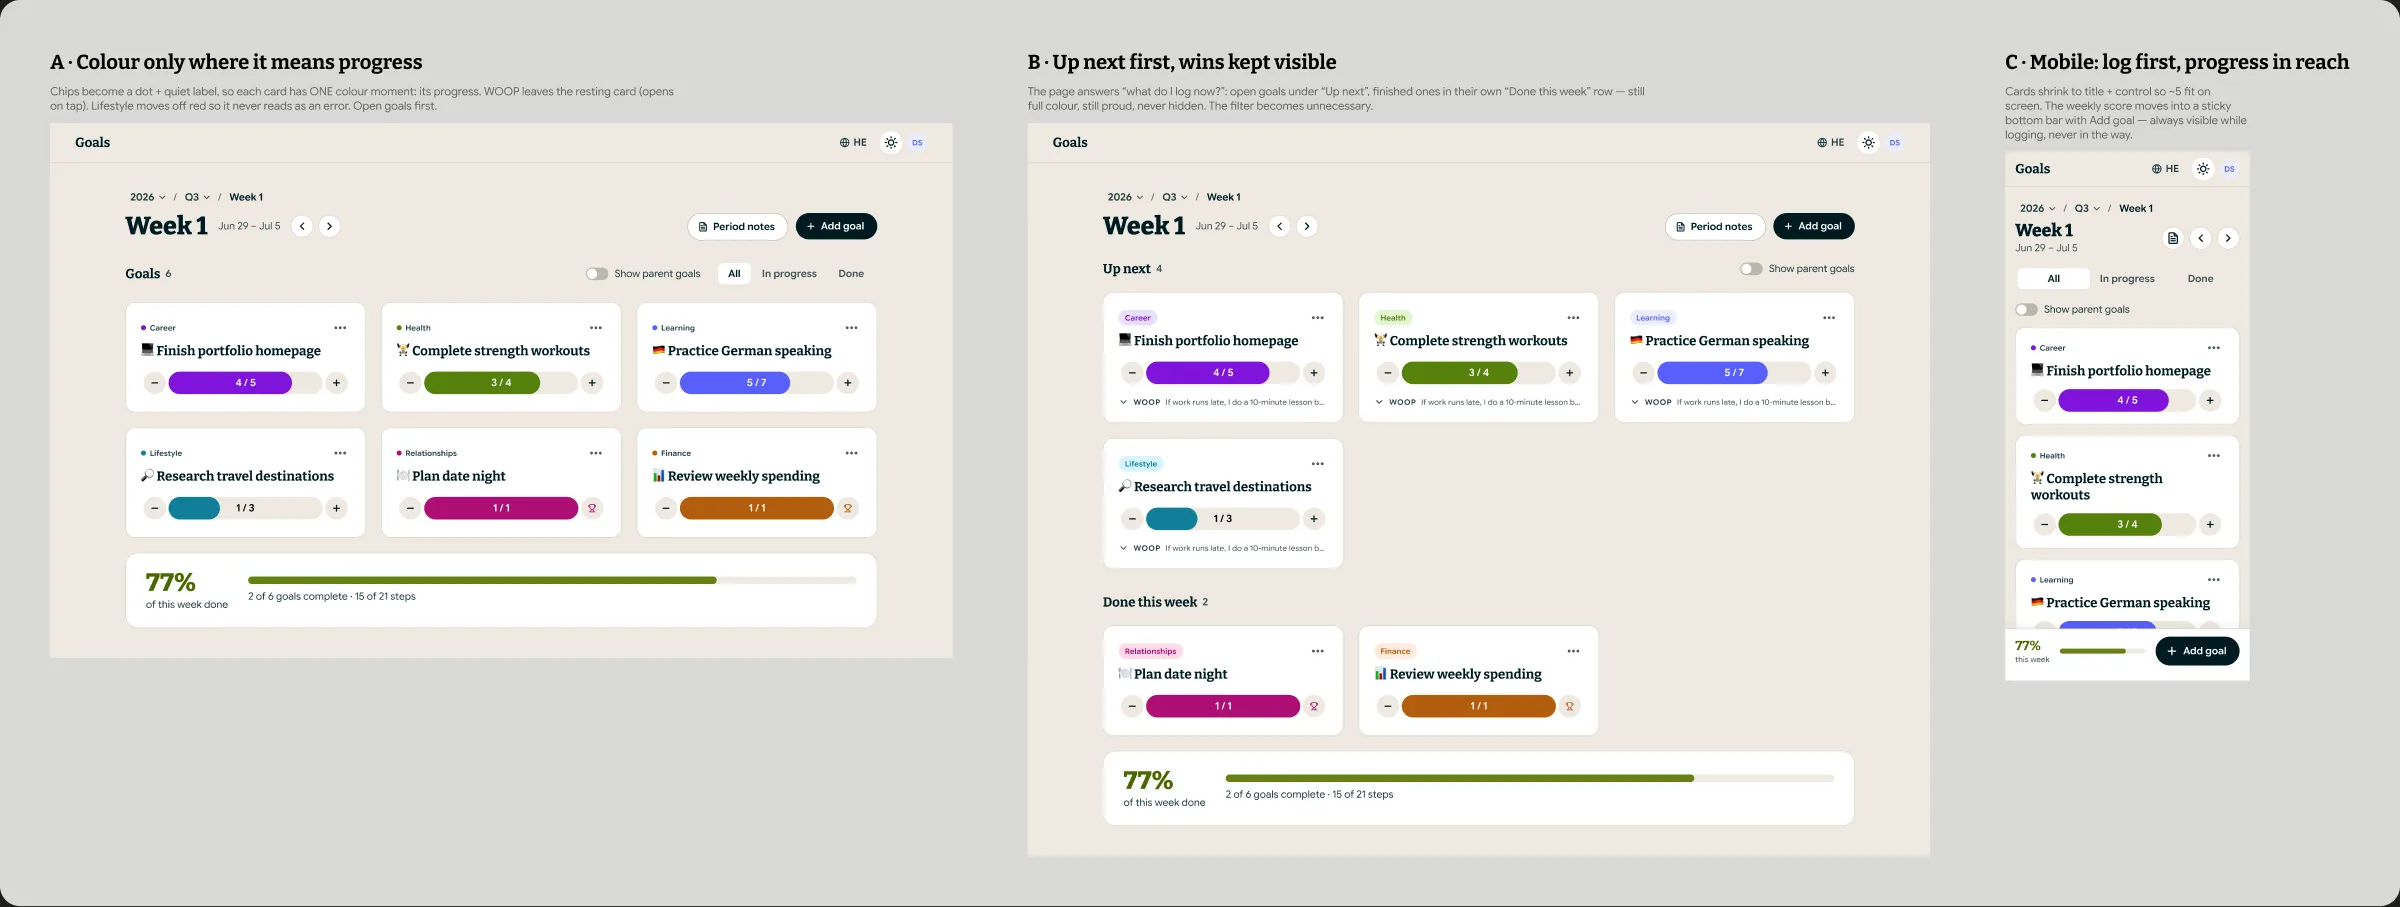
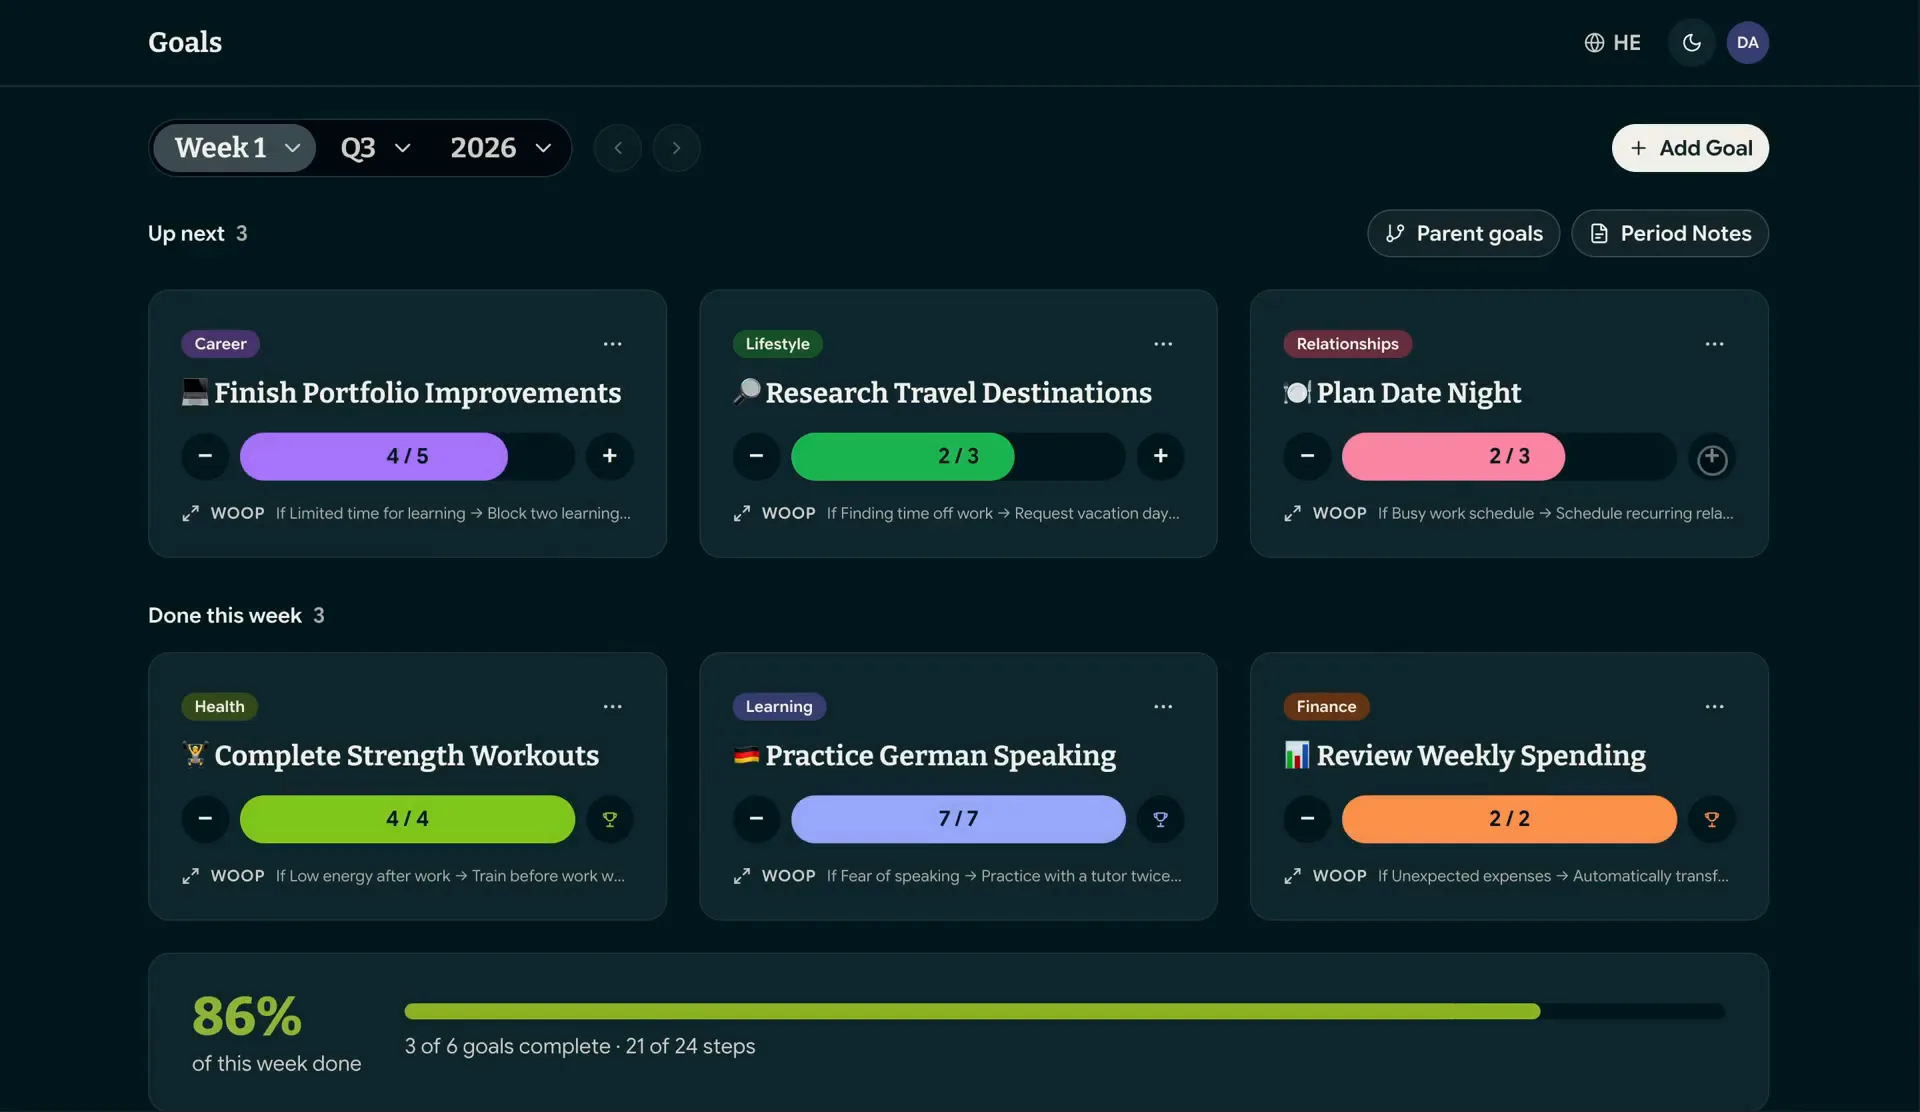
The weekly check-in should take seconds. I explored wide in Figma, then let a critique round decide.
- Layouts in greyscale, so colour couldn't sway the choice
- “Up next first, wins kept visible” won, and the filter wasn't needed any more
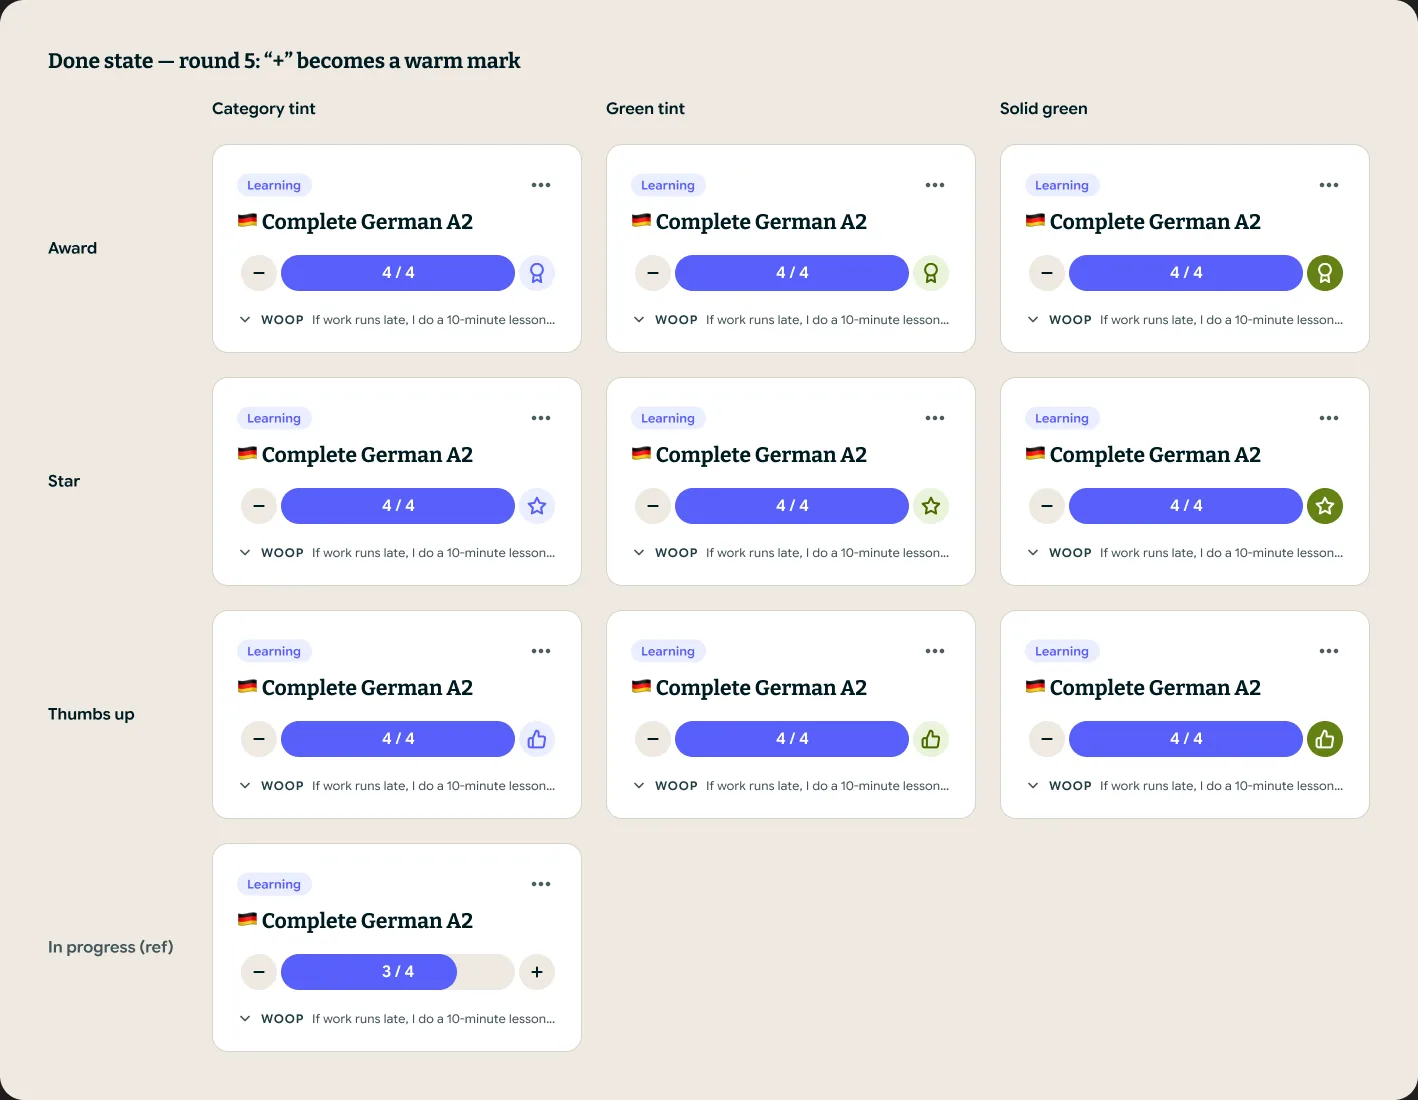
- The done state took 5 rounds: “+” turns into a warm mark
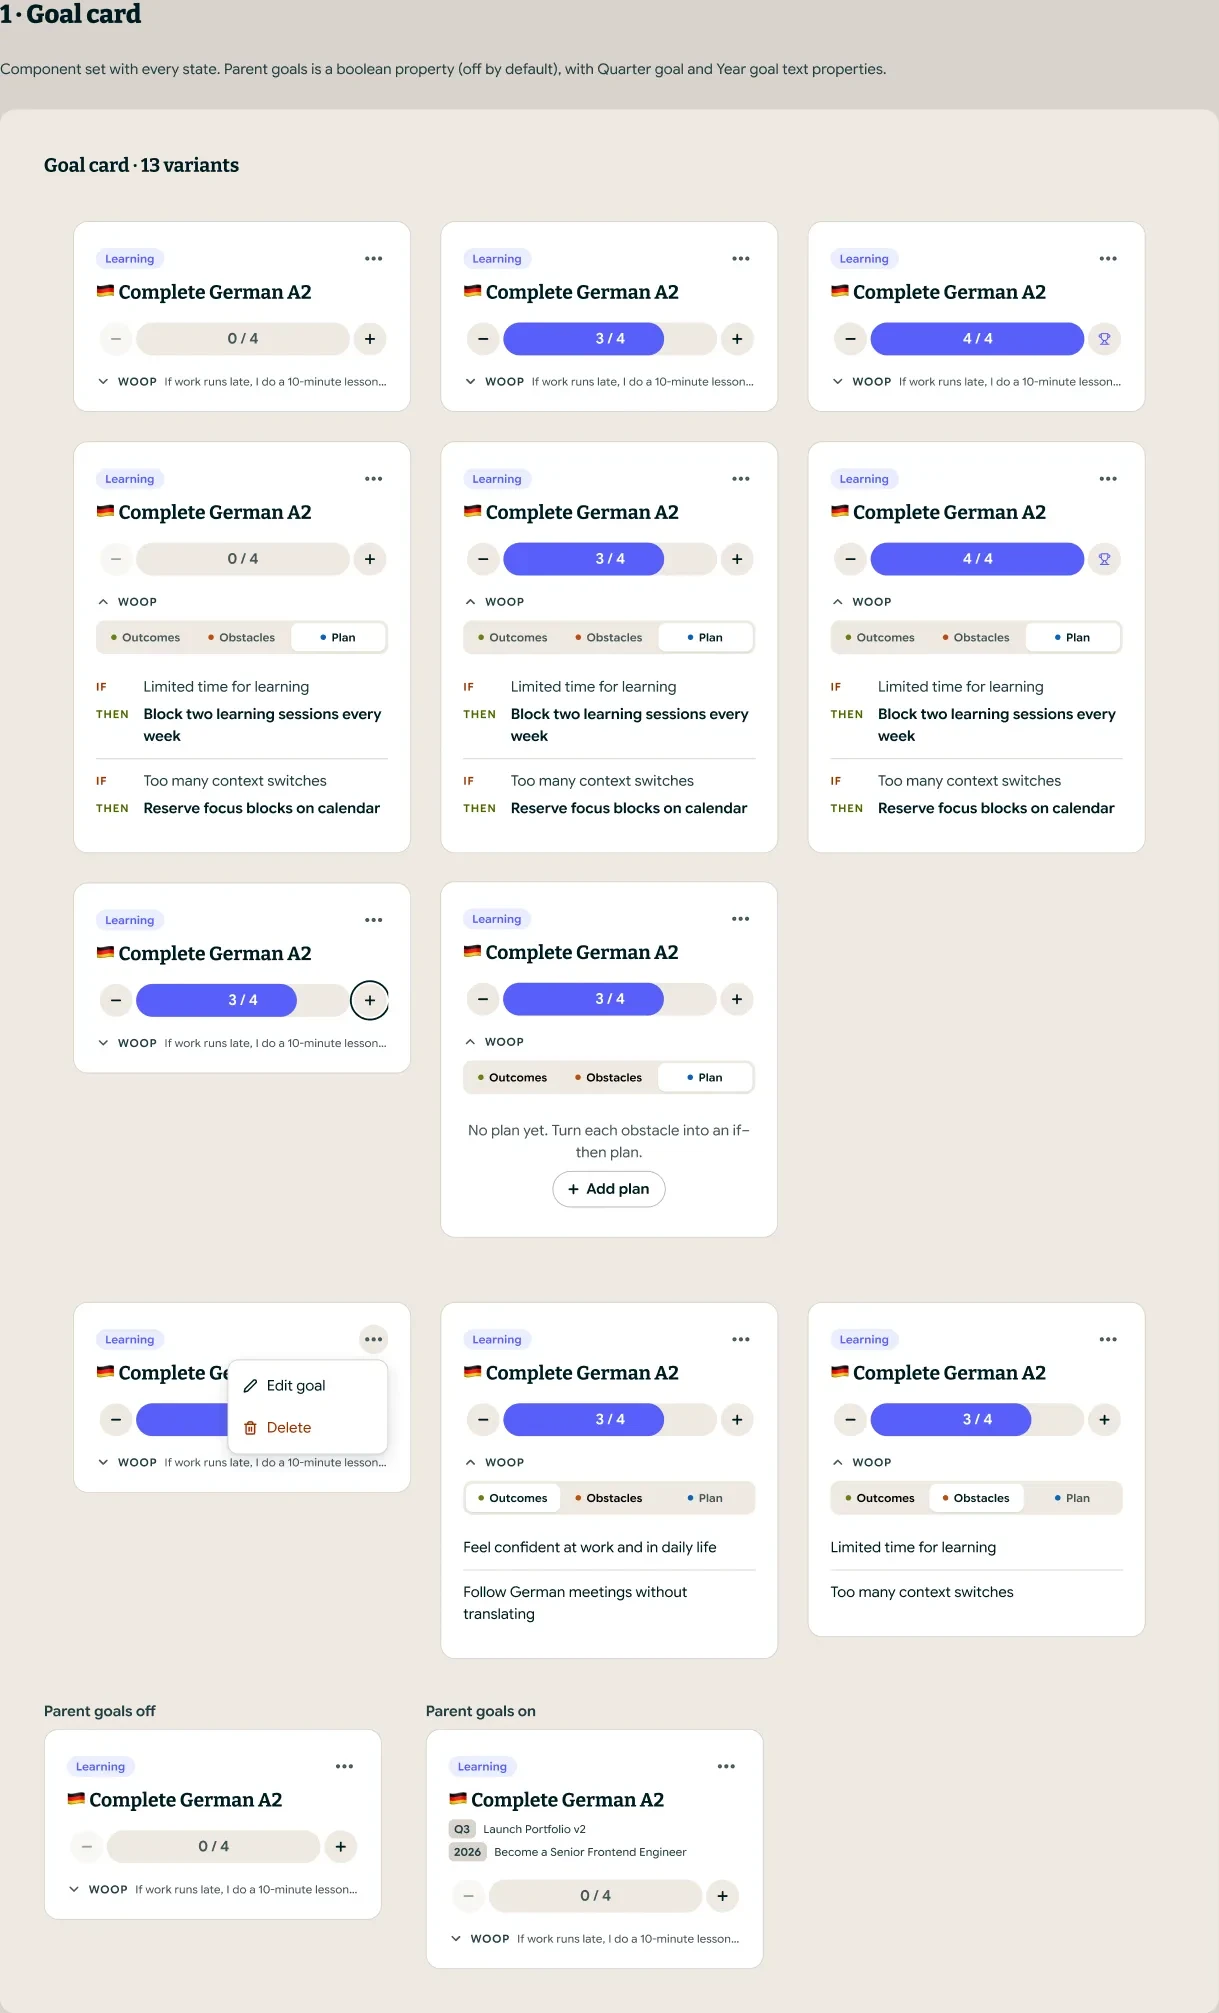
- One goal-card component, 13 variants
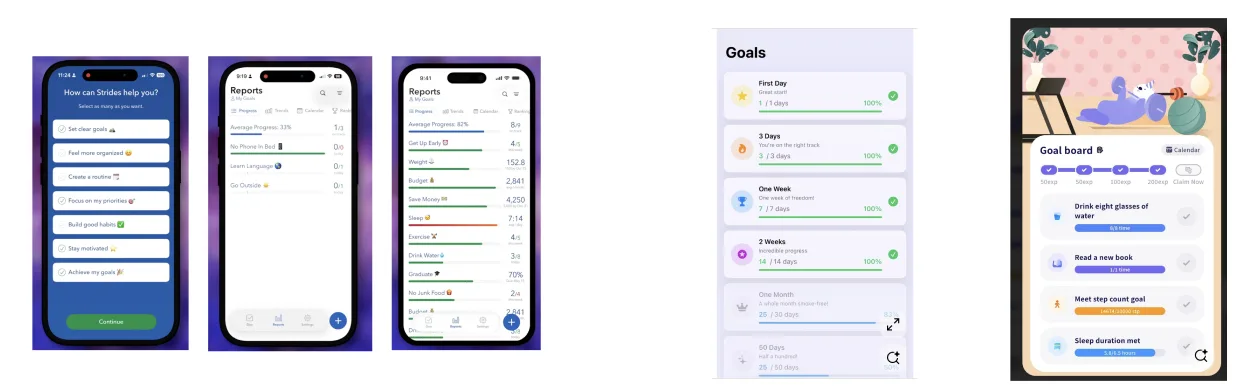
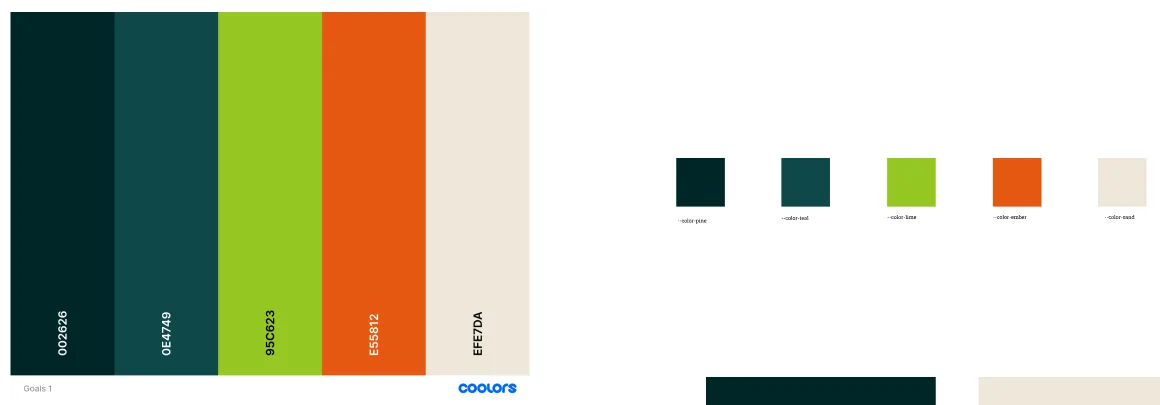
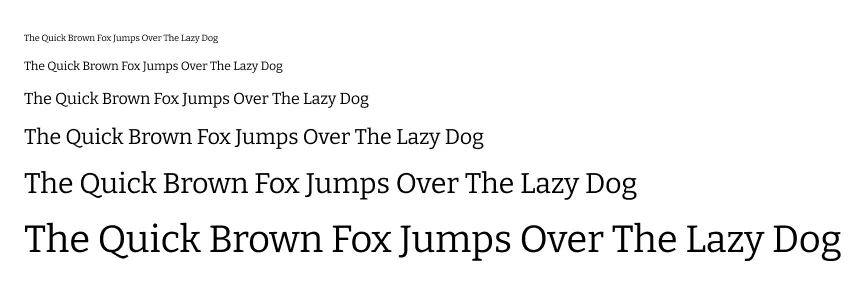

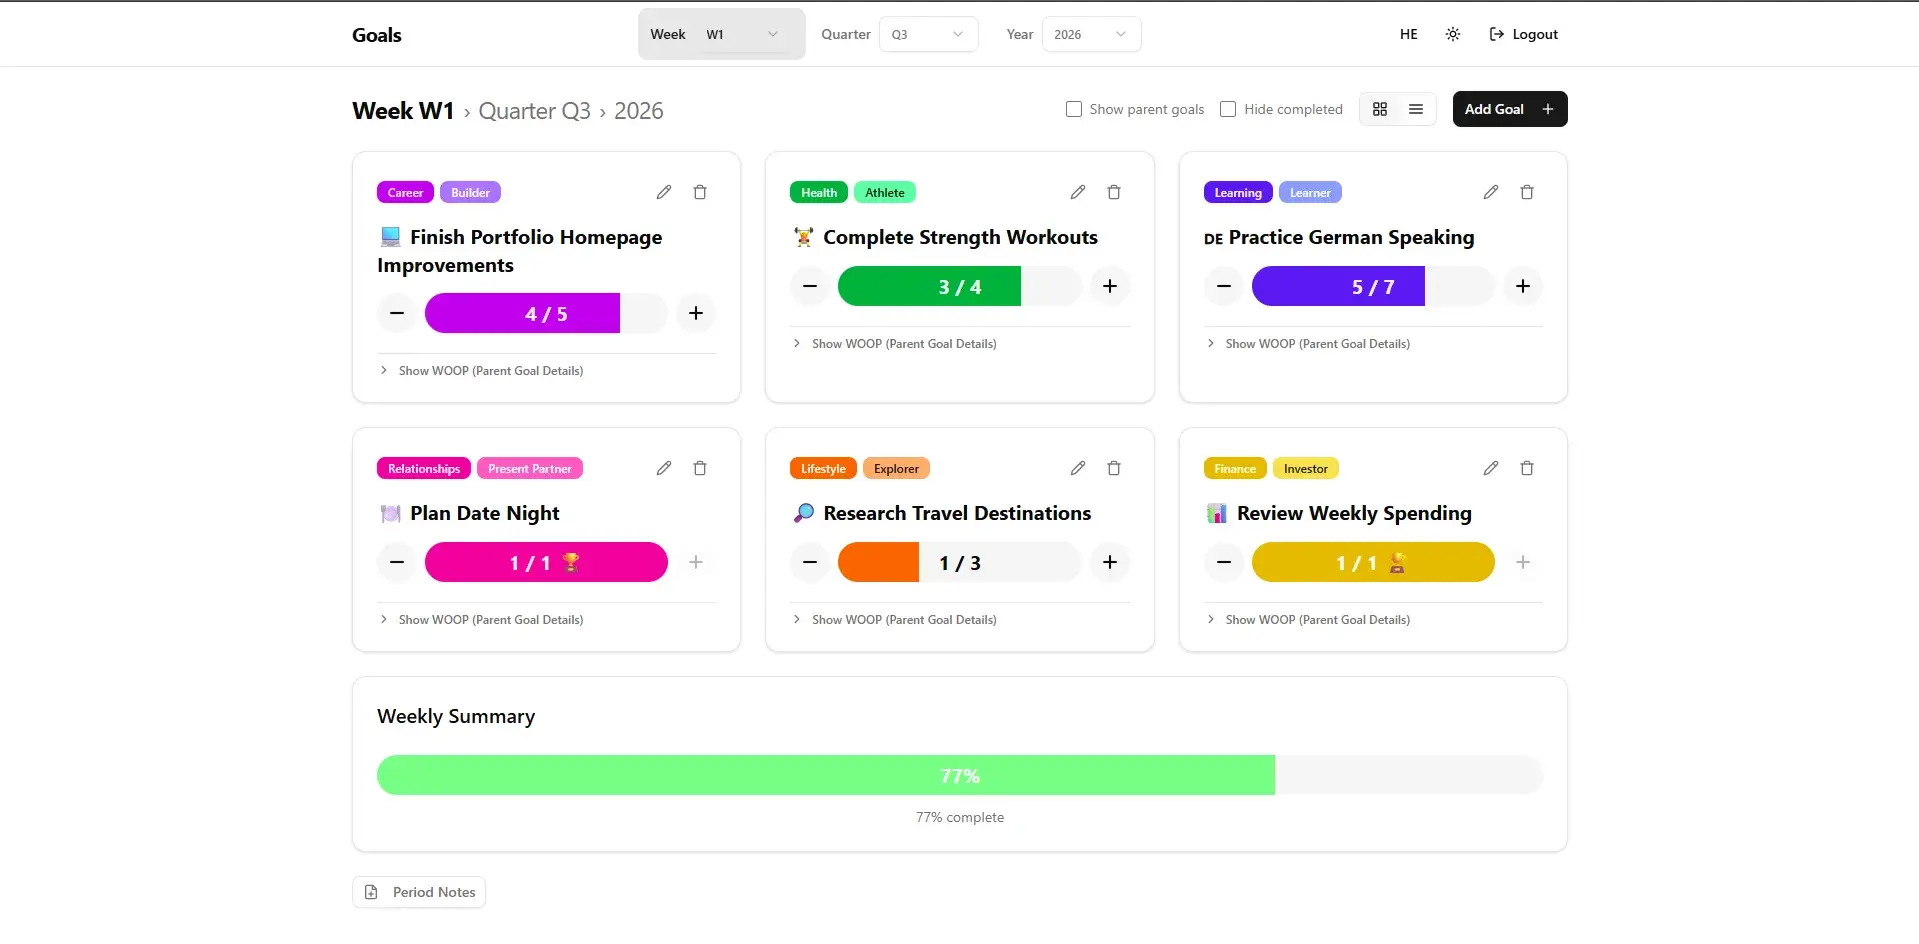
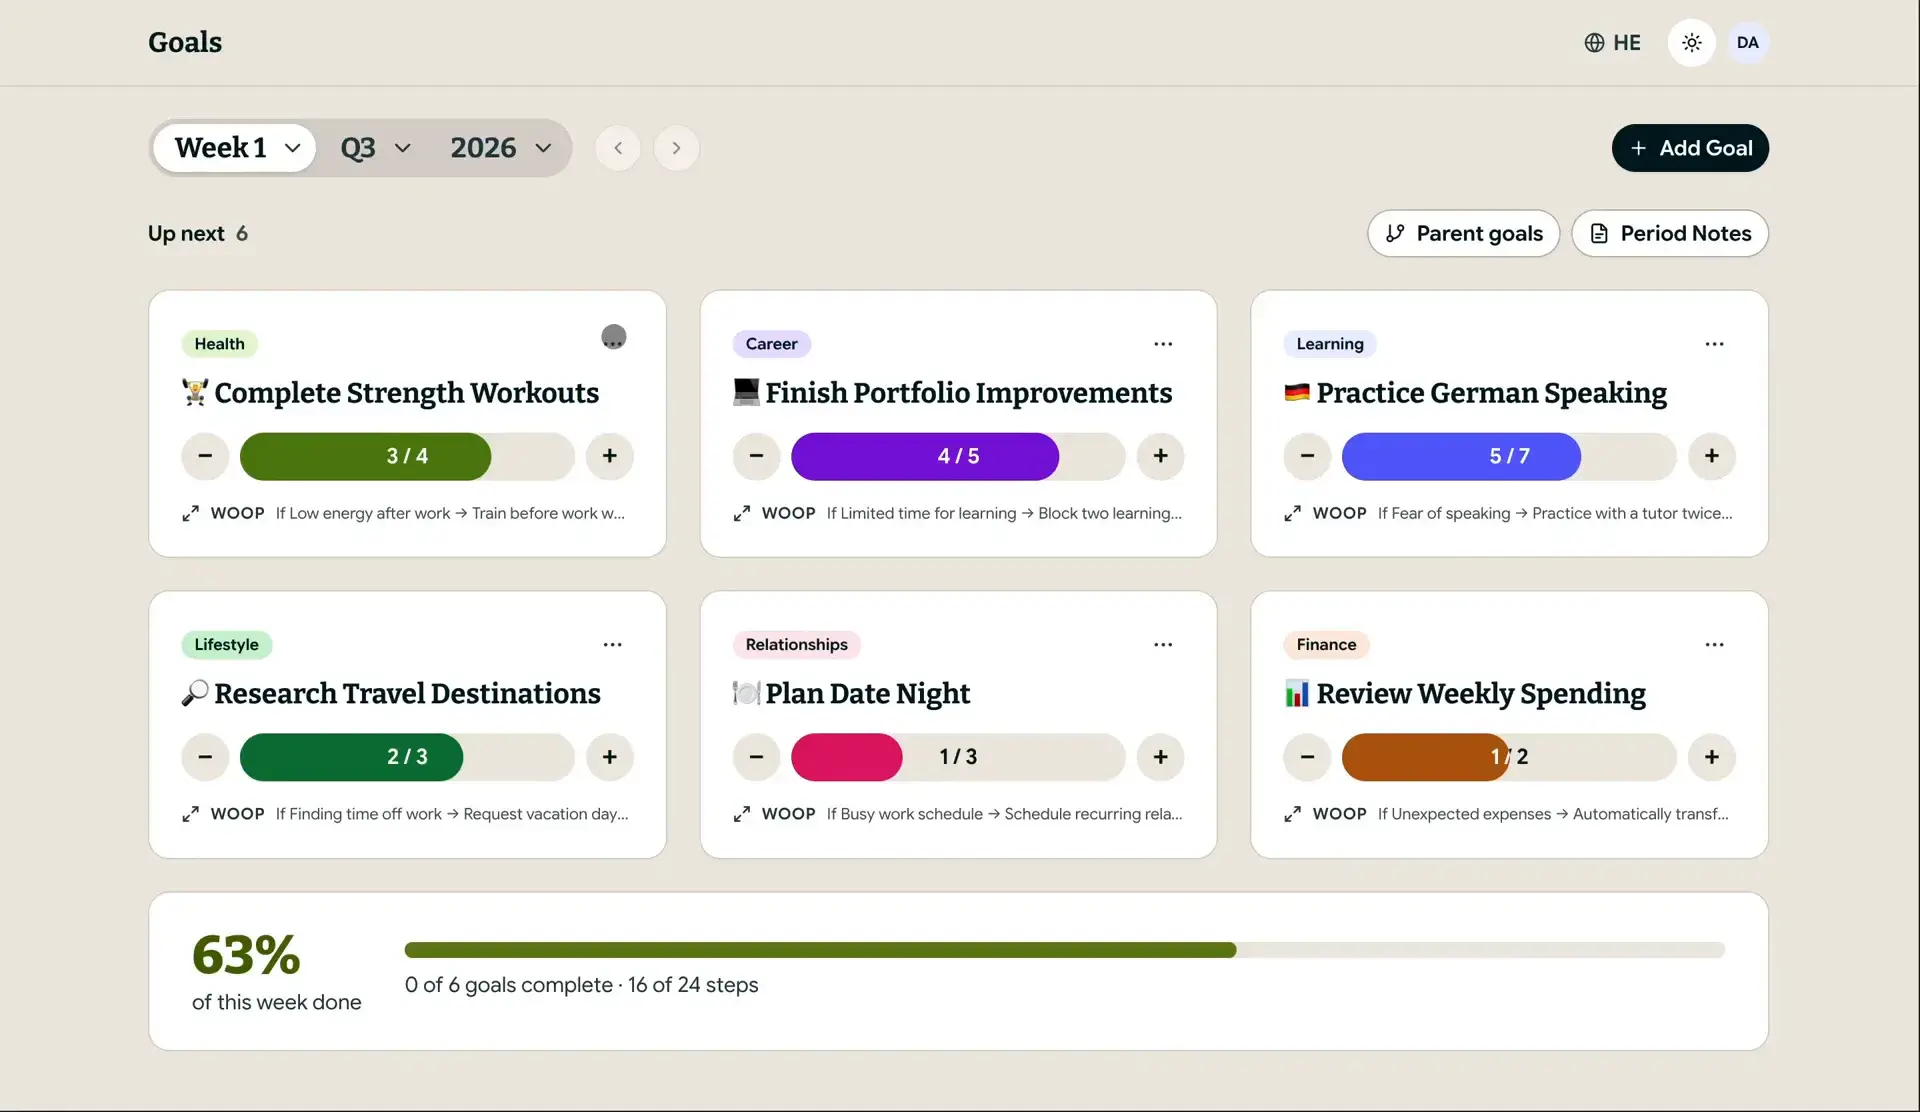
Drag the handle, or focus it and use the arrow keys, to compare v1 and v2.
Motion
A completion moment worth coming back for
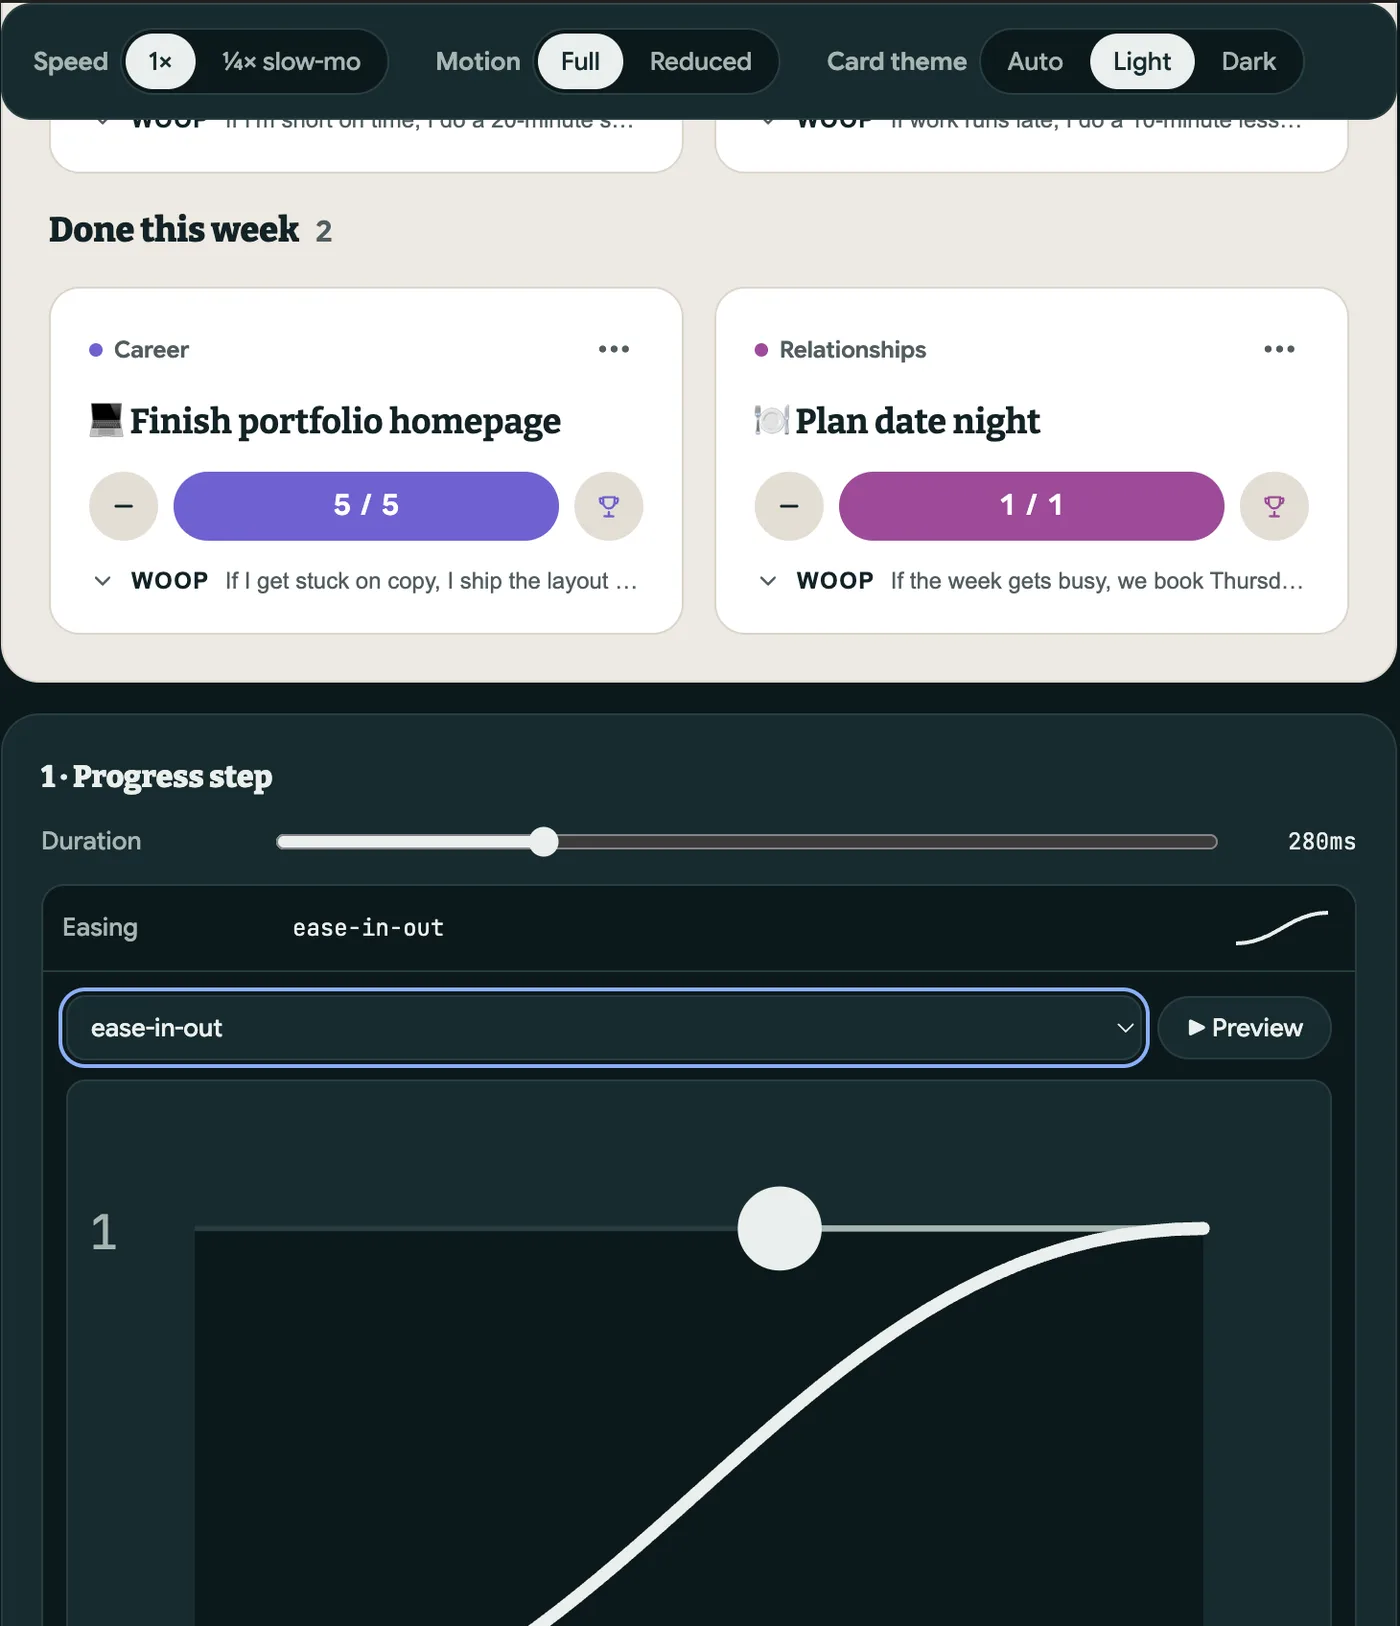
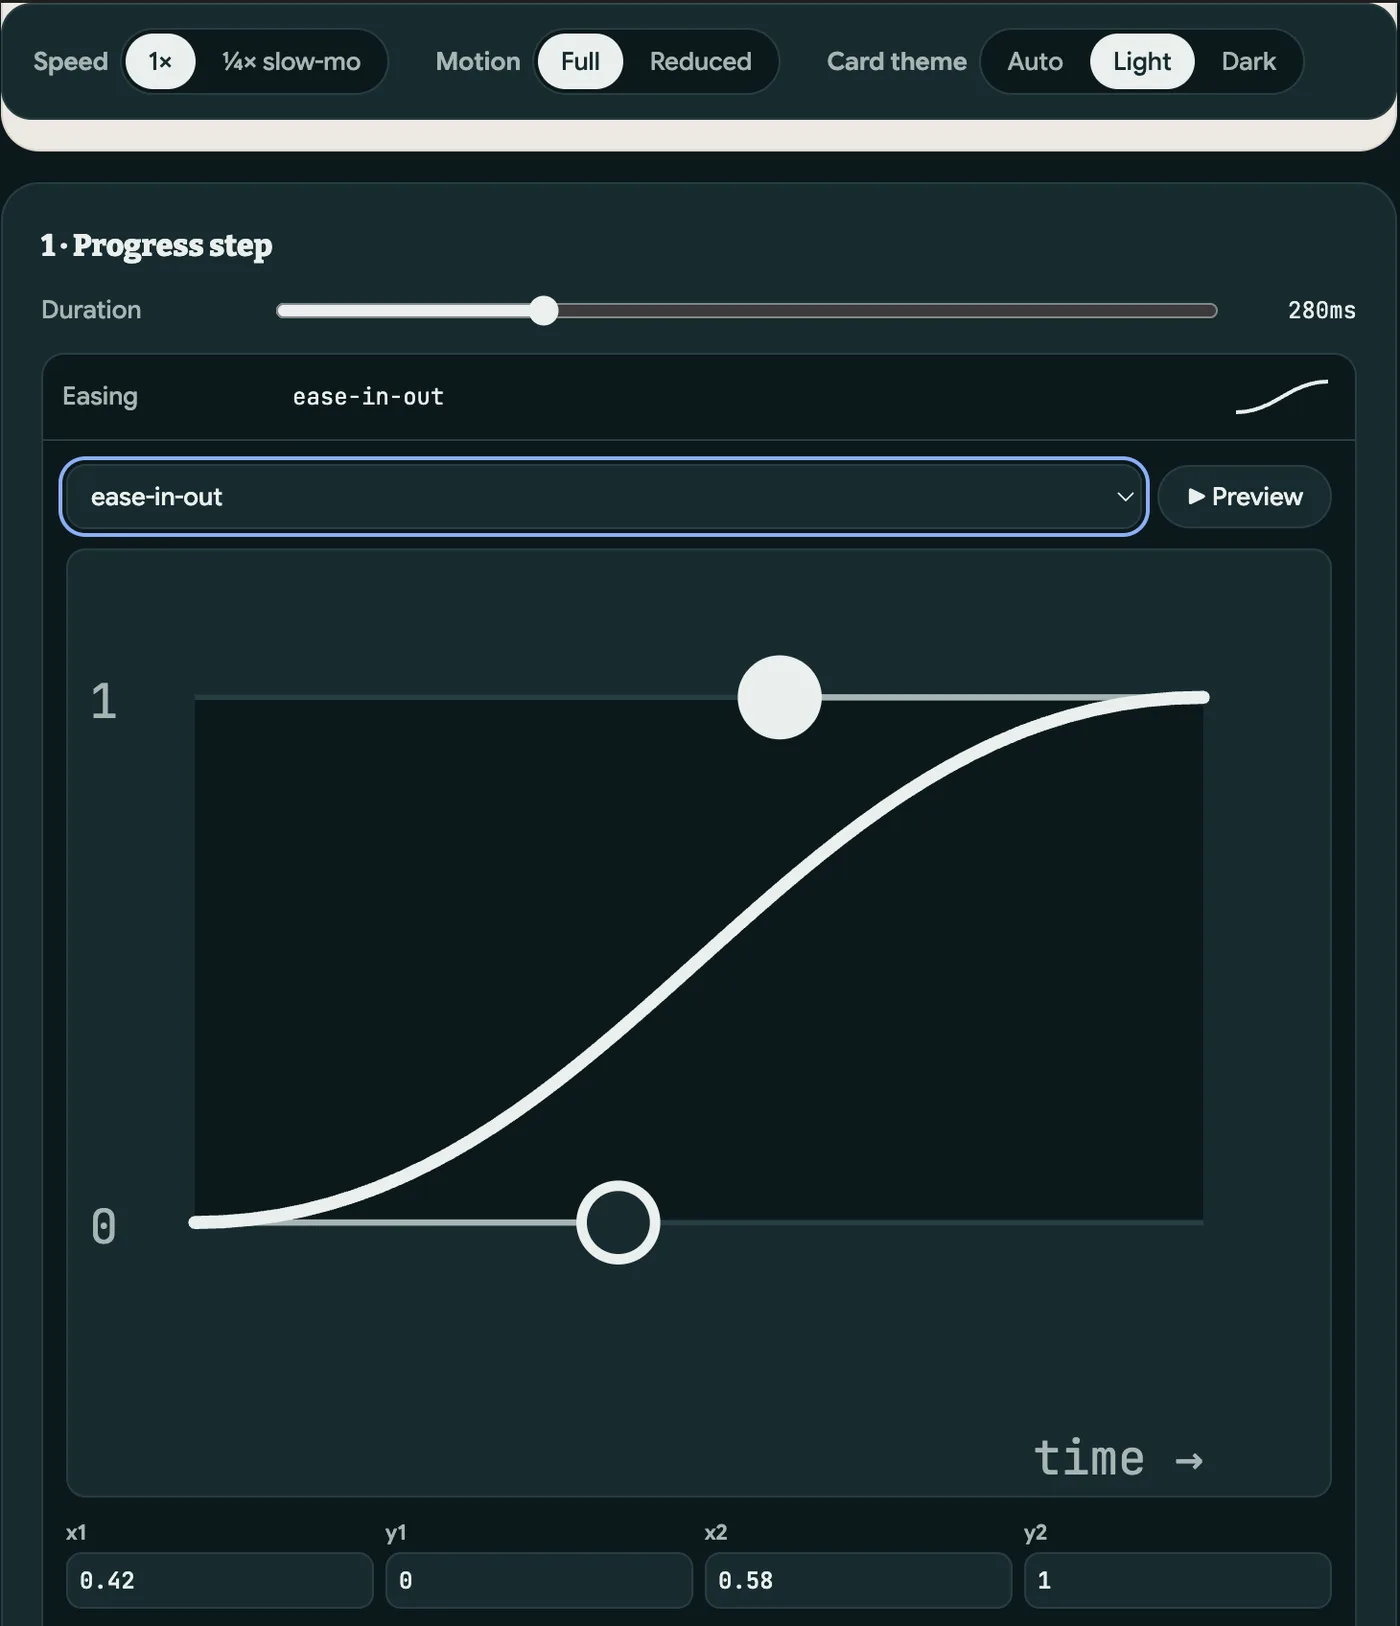
Fill, trophy, lift, move to Done, settle. Each step has its own duration and easing. I shaped them the way I would in After Effects, drawing on years as a motion designer, and built a Motion Lab with Claude Code to tune them on the real card: ¼× slow motion, a reduced-motion switch and a curve editor.
“Copy spec” exports the values into motion tokens. Every animated token needs a reduced-motion version, or the build fails.
The system underneath
Figma is the source of truth
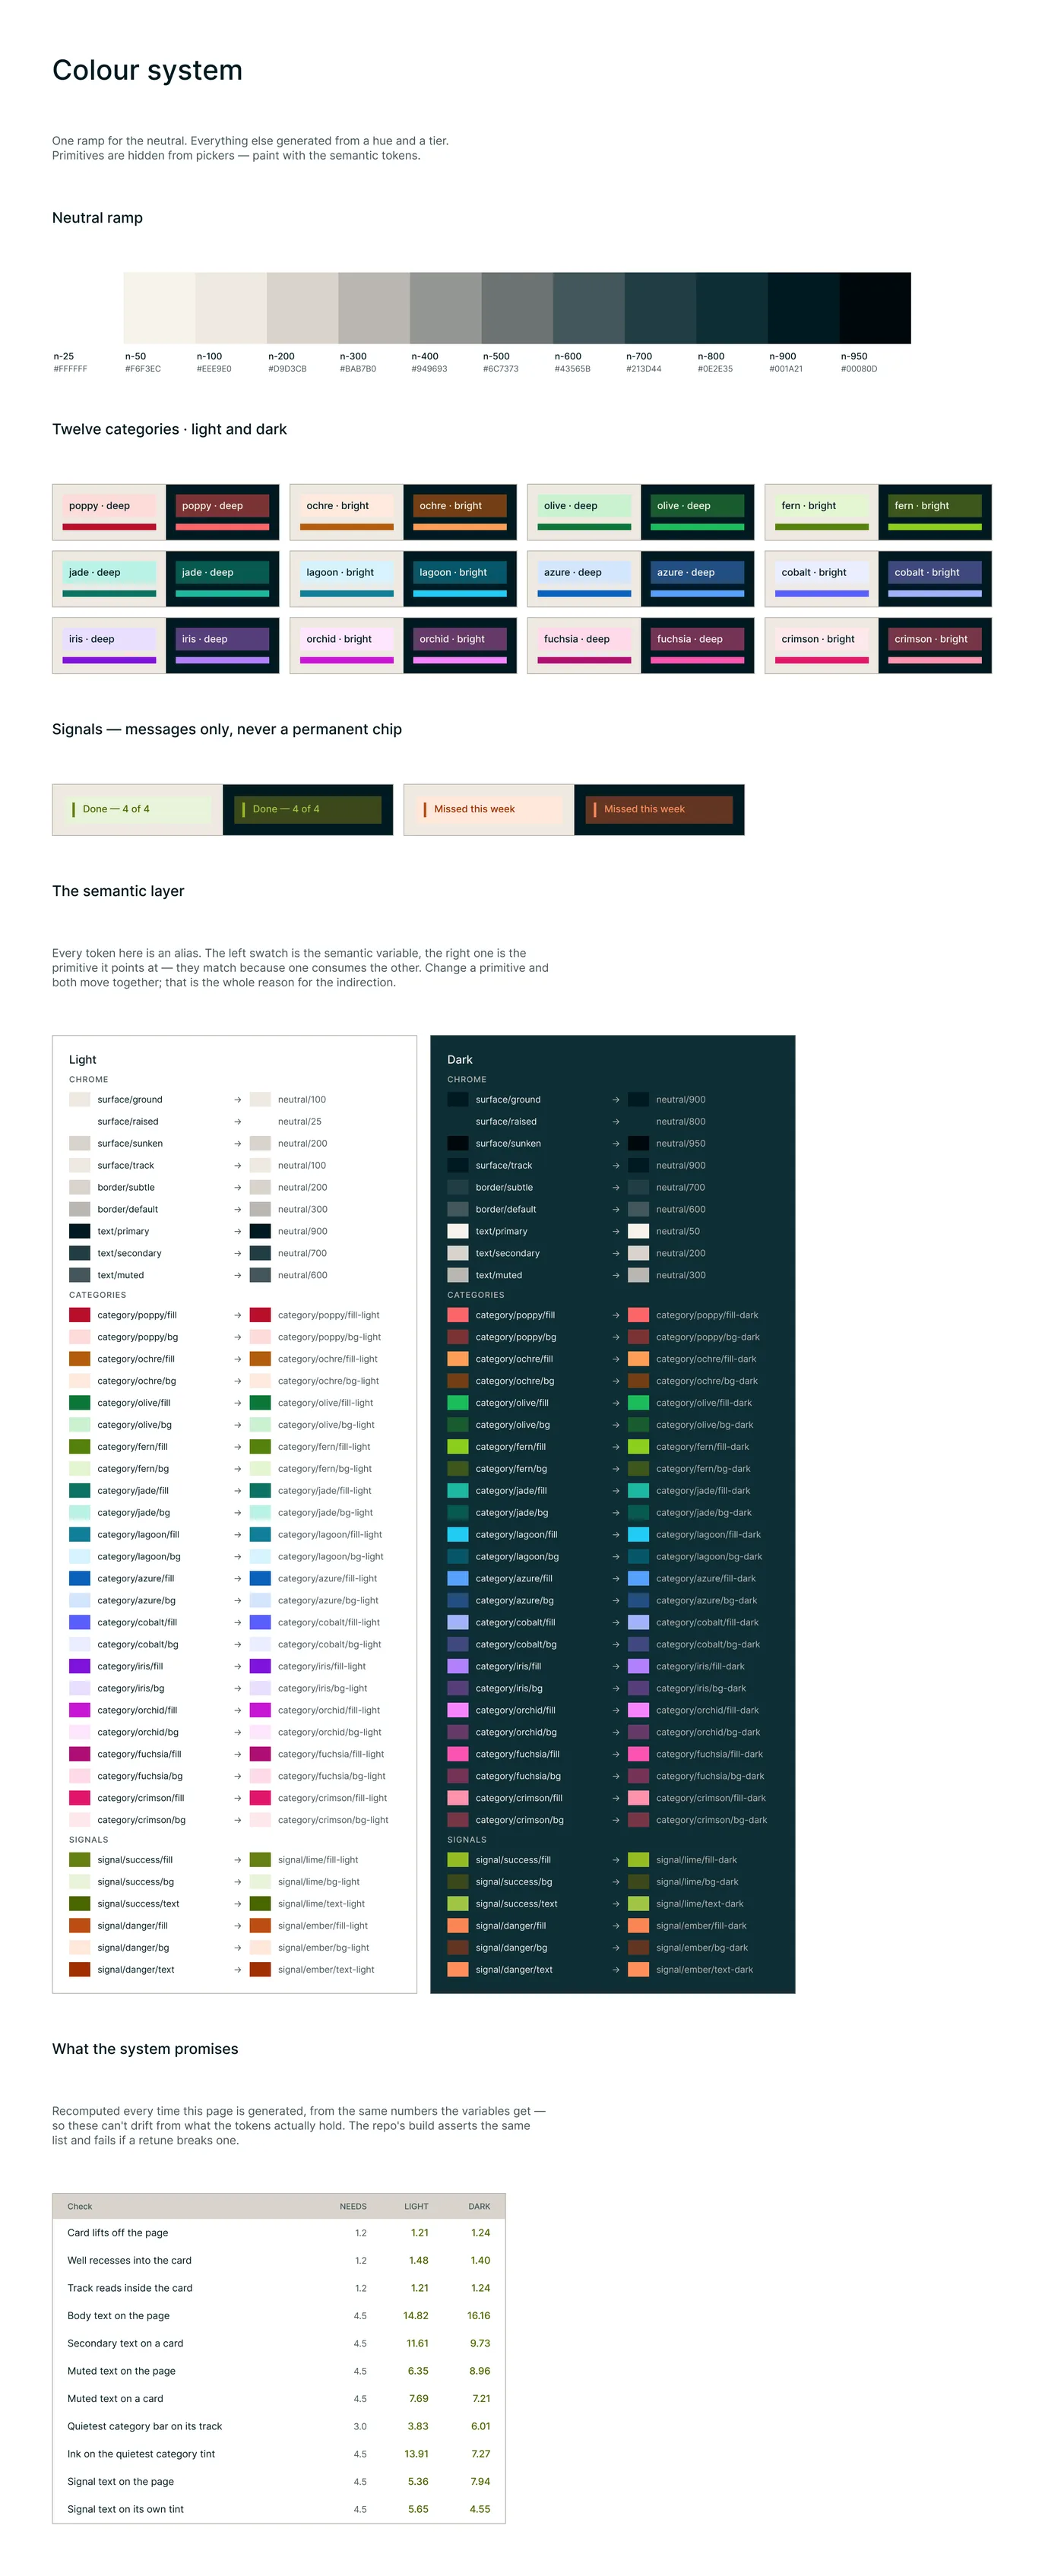
Colours, text styles, spacing and radius are decided in Figma. A plugin exports them, and one command builds the CSS and checks it. Twelve fixed categories replace the free colour picker, so contrast is guaranteed in light and dark.
The core loop works by keyboard: Tab to a card, then + or − to log. Focus follows the card when it moves to Done.
- Figma variables+ text styles
- Plugin exporttokens/figma.json
- npm run tokensCSS + motion.ts
- 106 checkscontrast · aliases · reduced motion
Outcome + learnings
A complex method, now easy to follow
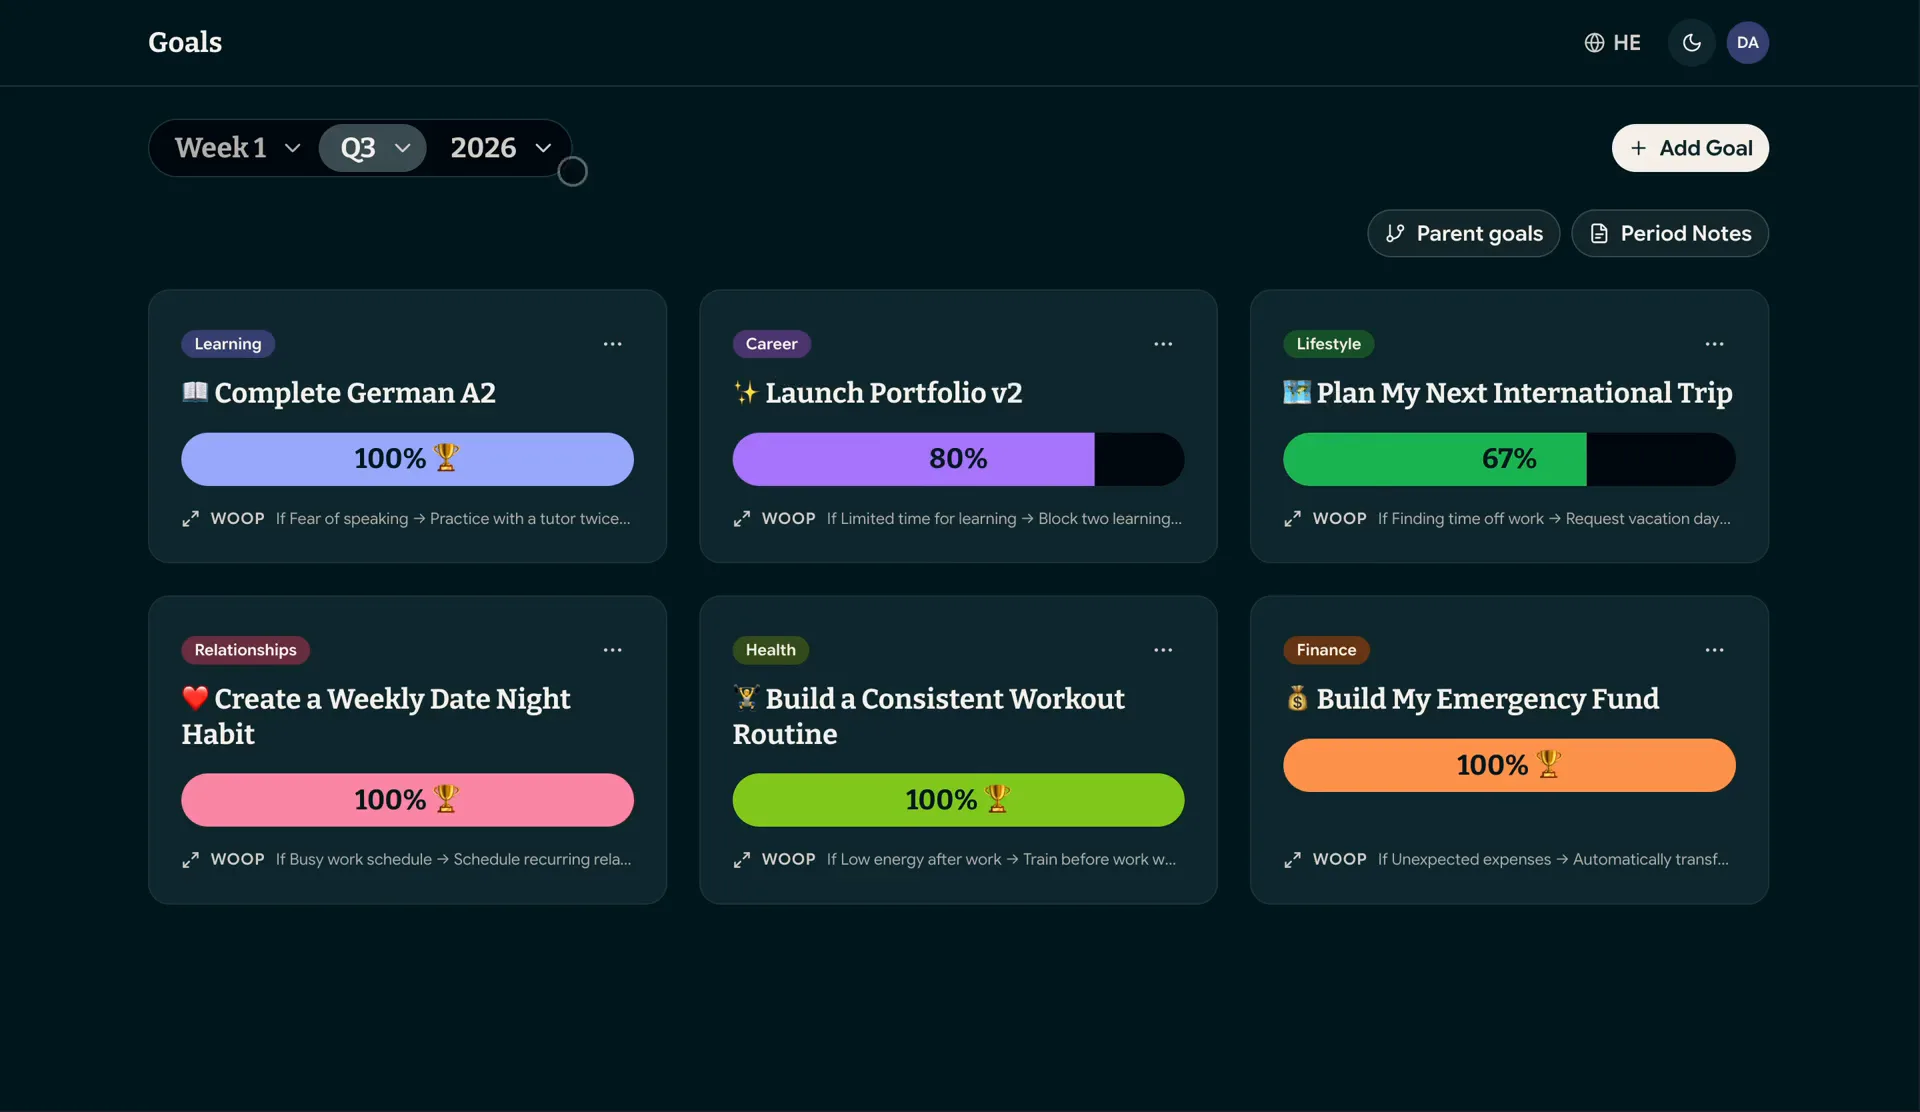
A method with many layers now takes you one step at a time, on phone and desktop, in one app instead of three spreadsheets. Every week shows which quarter and year goal it serves, and progress rolls up on its own: the counting I could never do by hand. I use it every week.
What's next
- Calendar sync. Weekly slots become real blocks in my calendar.
- An installable app. A PWA on the home screen, with gentle reminders.
- AI weekly reflection. A summary of the week and suggestions for the next one.
- Watch people sooner. A few live sessions found what months of my own use didn't.
- Let the build hold the line. An automated check caught a contrast break I would have shipped.
- Greyscale first. Deciding the layout without colour made the choice faster and more honest.